Spatiotemporal assessment of CVOC contamination in karst groundwater sources and exposure at tap water point of use in Puerto Rico
The “Trainee Publication Spotlight Series” aims to provide PROTECT trainees with opportunities to practice translating their research in a manner that would be understandable to non-scientific laypeople. Today’s trainee spotlight was written by Norma I. Torres on the publication “Spatiotemporal assessment of CVOC contamination in karst groundwater sources and exposure at tap water point of use.”
Authors: Vilda L. Rivera, Ingrid Y. Padilla, and Norma I. Torres
Karst aquifers are very important sources of freshwater. They have unique characteristics that make them highly productive, but at the same time, highly vulnerable to contamination1,2. This is indeed the case of the northern karst of Puerto Rico (Figure 1). This aquifer system, which is the largest source of freshwater in the island, has been affected by a long history of contamination of their groundwater resources3,4,5. The aquifer system is highly vulnerable to contamination through the areas that directly exposed to the surface.
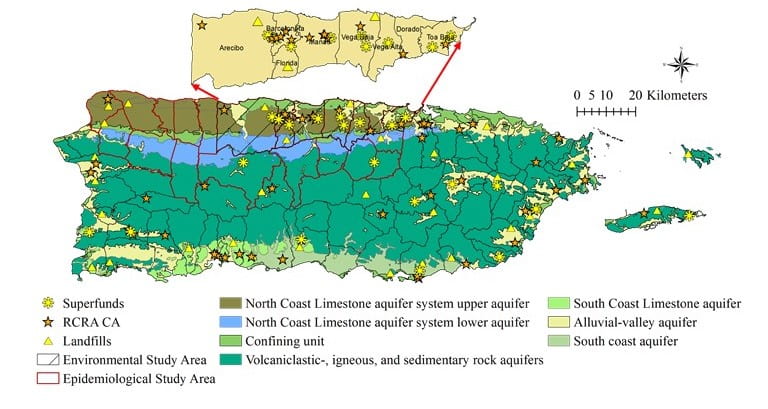
Figure 1. Hydrogeology and potential contamination sites in the study area within the Northern Karst Region of Puerto Rico
Contamination of groundwater resources used for drinking water represents a risk for exposure at the tap water point of use. Contamination with Chlorinated volatile organic compounds (CVOCs) is a concern because their presence in the environment can be translated to potentially adverse health impacts. This type of contaminants are commonly used in solvents, degreasing agents and a variety of commercial products6. Previous toxicological studies suggests that there are potential associations with cancer6 and adverse reproductive outcomes7,8.
This study assess potential associations between CVOC contamination of groundwater in the aquifers of the northern karst system of Puerto Rico and that at the tap water point of use. The objectives of the study were attained by two methodologies of analysis: spatial analysis using Geographic Information Systems (GIS) and statistical analysis.
The data used for the analysis was obtained from different sources: historical data, collected from water quality reports from regulatory agencies, current groundwater samples, collected from wells and springs in the study area three times a year (Figure 2a), and tap water samples collected throughout the year from the homes of pregnant women participants in the PROTECT center9 (figure 2b). Both, collection and sample analysis is done following standard procedures10,11,12,13.
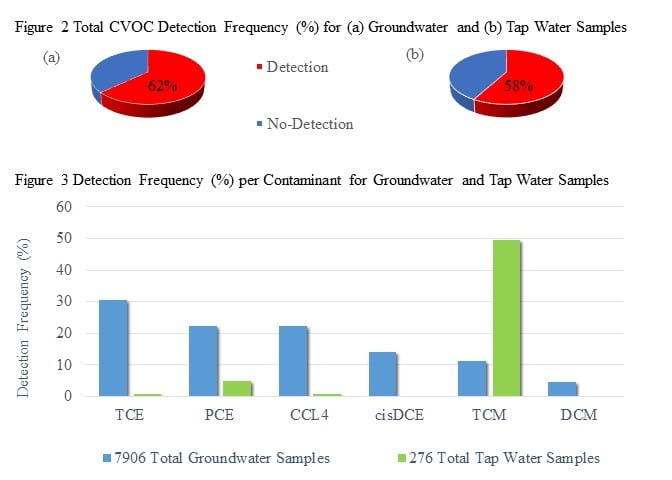
Figure 2. Groundwater (a) and tap water (b) sampling of CVOCs collected by UPRM
Figure 3. Detection frequency (%) per contaminant in groundwater and tap water samples
Results showed that there is an extensive presence of CVOC in groundwater and tap water in the study area, present in 62% of groundwater and 58% of tap water samples, respectively. Carbon tetrachloride (CCl4), tetrachloroethene (PCE), and trichloroethene (TCE) (Figure 3) were found in higher concentrations and detection frequencies in groundwater than in tap water. However, trichloromethane (TCM) was found at higher frequencies and concentrations in tap water than in groundwater, suggesting that there are other sources of contamination in tap water.
Contamination was observed to be spatially distributed throughout the study area, but there are some areas some hotspots with high concentrations in certain regions (Figure 4), which may be influenced by the location and type of sources of contamination in the area. Temporal analysis shows a decreasing concentration trend for CVOC in both, tap water and groundwater (Figure 5), which may be influenced by remediation activities in the area. In general, spatial and temporal analysis of the data showed that contamination comes from multiple source, and that association between tap water and groundwater will depend on the type of contaminant, spatial location and time.
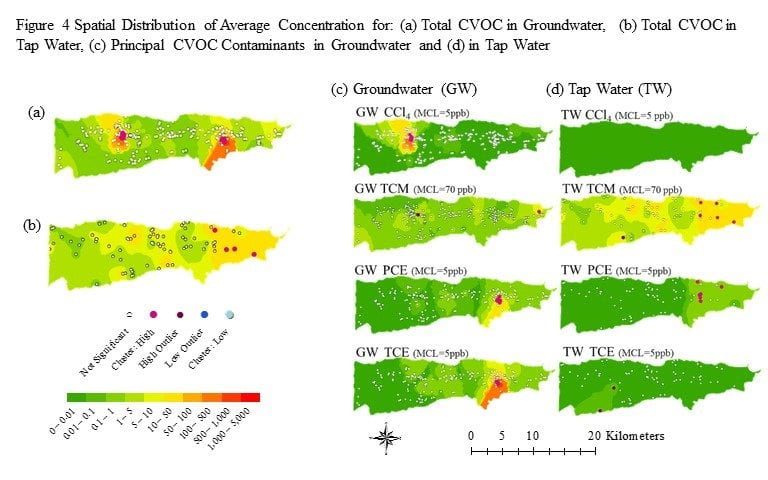
Figure 4. Spatial distribution of average concentration for (a) Total CVOCs in groundwater, (b) Total CVOCs in tap water, (c) most detected CVOCs contaminants in groundwater and (d) in tap water
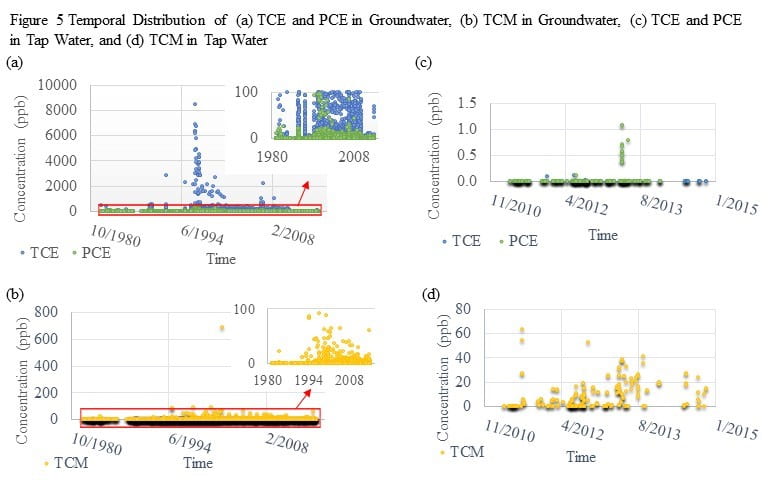
Figure 5. Temporal distribution of (a) TCE and PCE in groundwater, (b) TCM in groundwater, (c) TCE and PCE in tap wter and (d) TCM in tap water
References:
- Göppert N and Goldscheider N (2008) Solute and colloid transport in karst conduits under low- and high-flow conditions. Ground Water 46 (1): 61-68
- Green RT, Painter SL, Sun A, Worthington SRH (2006) Groundwater Contamination in Karst Terranes. Water, Air and Soil Pollution 6 (1-2): 157-170
- Padilla I, Irizarry C, Steele K (2011) Historical Contamination of Groundwater Resources in the North Coast Karst Aquifer of Puerto Rico. Revista Dimensión 3: 7-12
- Padilla I, Rivera V, Irizarry C. (2015). Spatiotemporal Response of CVOC Contamination and Remedial Actions in Eogenetic Karst Aquifers. NCKRI Symposium 5 Proceedings of the 14th Multidisciplinary Conference on Sinkholes and the Engineering and Environmental Impacts of Karst
- Yu X, Ghasemizadeh R, Padilla I, Irizarry C, Kaeli D, Alshawabkeh A (2015) Spatiotemporal Changes of CVOC Concentrations in Karst Aquifers: Analysis of Three Decades of Data from Puerto Rico. Science of the Total Environment 511:1-10
- Huang B, Lei C, Wei C, Zeng G. 2014. Chlorinated Volatile Organic Compounds (Cl-VOCs) in Environment- Sources, Potential Human Health Impacts, and Current Remediation Technologies. Environmental International 71: 118-138
- Meeker JD, Howard H, Cantonwide DE, Lamadrid-Figueroa H, Calafat HA, Ettinger AS, Hernandez-Avila M, Loch-Caruso R, Téllez-Rojo M (2009) Urinary Phthalate Metabolites in Relation to Preterm Birth in Mexico City. Environmental Health Perspectives 117: 1587-1592
- Nieuwenhuijsen MJ, Toledano MB , Eaton NE, Fawell J, Elliott P. 2000. Chlorination Disinfection Byproducts in Water and Their Association with Adverse Reproductive Outcomes: A Review. Occupational and Environmental Medicine 57 (2): 73-85. http://www.jstor.org/stable/27731265 Accessed March 2016
- Cordero J, Meeker J, Sheahan T, Padilla I, Giese R, Silevitch M, Loch-Caruso R, Kaeli D, Alshawabkeh A (2012) Case Study- Puerto Rico Test Site for Exploring Contamination Threats. GeoCongress 2012: 3553-3562
- Koterba MT, Wilde FD, Lapham WW (1995) Groundwater Data Collection Protocols and Procedures for the National Water Quality Assessment Program: Collection and Documentation of Water Quality Samples and Related Data. US Geological Survey Open File Report 95-399. Reston, Virginia
- 2007. ASTM Guide D44448-01, Standard Guide for Sampling Groundwater Monitoring Wells. ASTM International, West Conshohocken, PA.
- Cotto I. 2015. Monitoring Phthalates and Chlorinated Volatile Organic Compounds in Groundwater and Tap Water. Master’s Graduate Thesis. Puerto Rico: University of Puerto Rico, Mayaguez Campus
- Munch DJ, Hautman DP. 1995. Method 551.1 Determination of Chlorination Disinfection Byproducts, Chlorinated Solvents, and Halogenated Pesticides/Herbicides in Drinking Water by Liquid-liquid Extraction and Gas Chromatography with Electron-capture Detection. U.S. Environmental Protection Agency Cincinnati, Ohio 45268